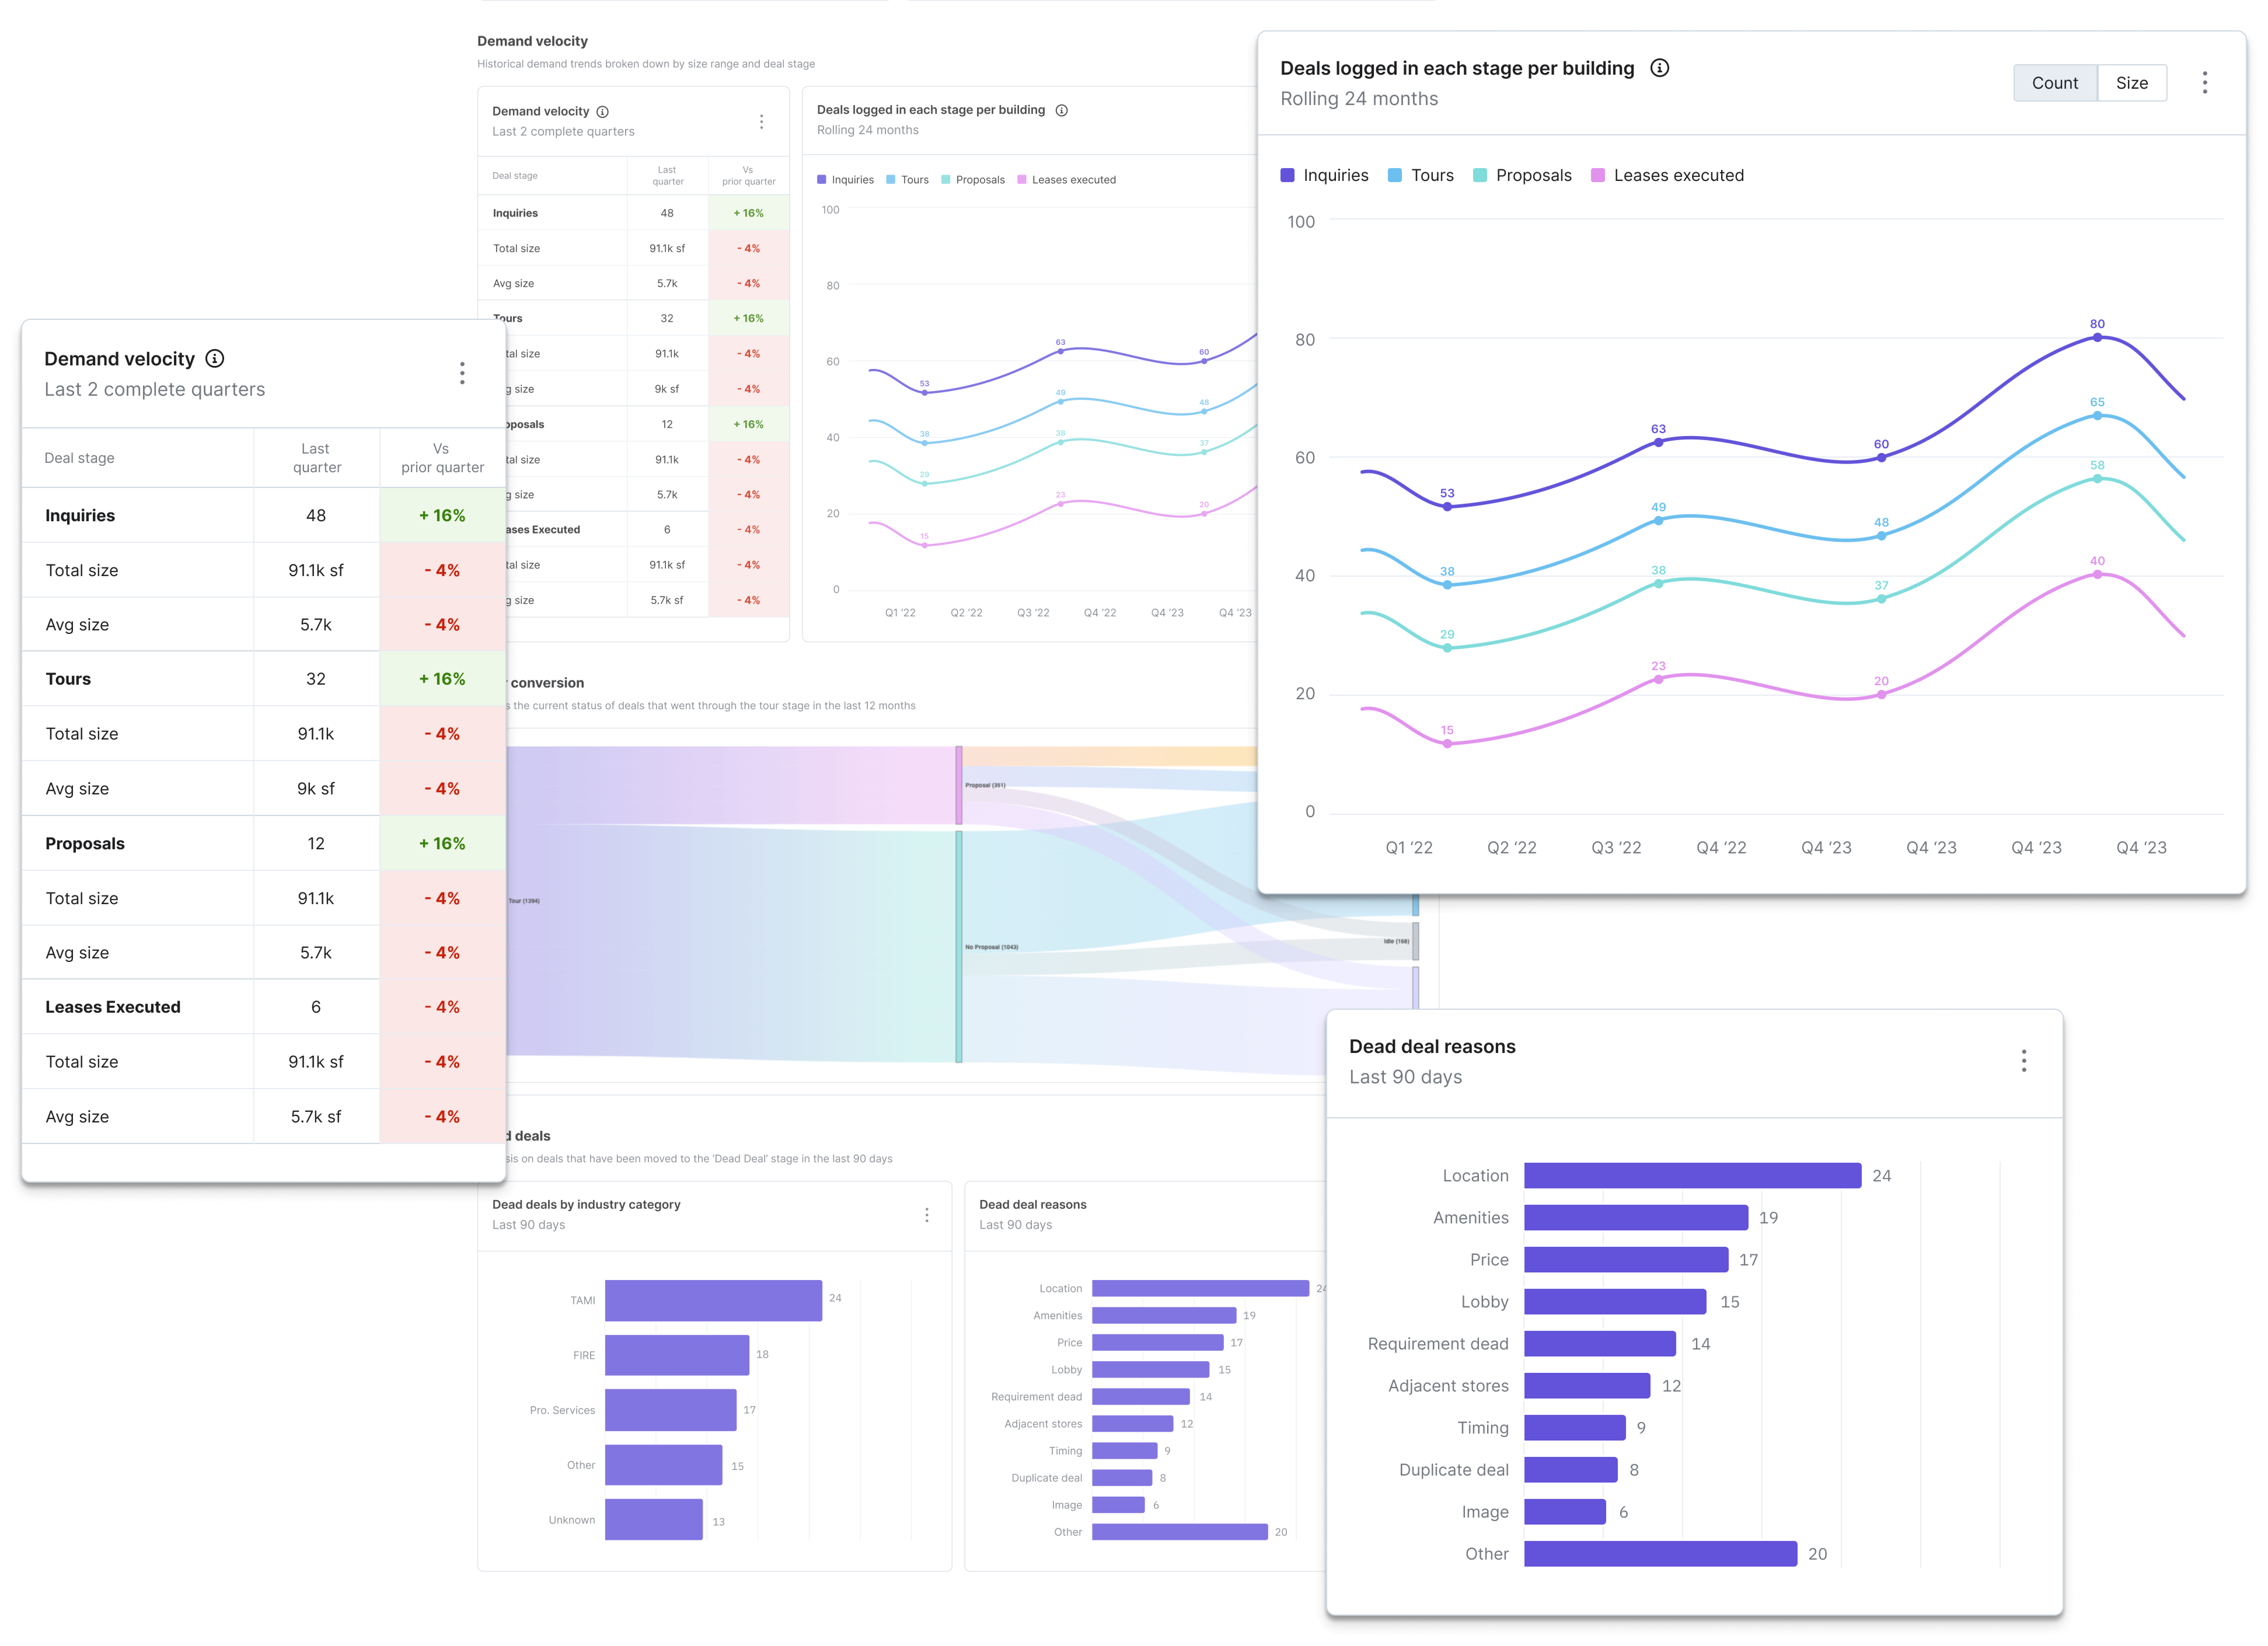
Leasing Activity Report
The final result was a streamlined dashboard that addressed brokers core needs: providing actionable data to defend their performance, gain a competitive edge, and win new business. Post release, our team continued to iterate, incorporating new data points and enhancements to further support brokers and ensure the dashboard remained impactful.
Portfolio Insights
While not covered in depth in this case study, Portfolio Insights was a major release within VTS4, featuring five additional dashboards designed to help asset managers address their most critical questions. We applied the same user-centered methodology as with the LAR, collaborating closely with asset managers to identify their key metrics and working backward to design dashboards that met their needs. These dashboards were continuously refined over several months based on iterative feedback, ensuring they delivered meaningful and actionable insights.
VTS Data
Though not explored in detail in this case study, VTS Data emerged as a significant and unexpected win from this initiative, transforming an offline Google Slides report into an online experience using our new Looker components. Originally, the organization had estimated $1 million and over six months to complete this task. However, leveraging our components, we accomplished it in under one month, showcasing the efficiency and scalability of our new solution.